China Customer Relations Centers, Inc.
China Customer Relations Centers, Inc. (CCRC) PE Ratio — Current & Historical Data
Trailing twelve months (TTM) P/E, forward P/E, PEG, and annual PE history — from market prices and filings.
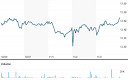
ccrc · pe ratio · data through Jun 9, 2026
Core PE Ratio Metrics
Trailing 12 months · TTMInsufficient PE history data (fewer than 3 valid fiscal years).
PE Ratio vs Peers
Information Technology Services · 5 peers · Annual PE| Company | Market Cap | PE (Annual) | vs Avg | EPS (TTM) |
|---|---|---|---|---|
China Customer Relations Centers, Inc.You CCRC | — | N/A | — | — |
Alithya Group Inc. ALYA | $110M | N/A | — | -$0.17 |
China Index Holdings Limited CIH | $86M | 1.99x | -83.3% | $3.10 |
Climb Global Solutions, Inc. CLMB | $442M | 21.80x | +83.3% | $1.18 |
Kaleyra, Inc. KLR | $96M | N/A | — | -$7.86 |
Markforged Holding Corporation MKFG | $98M | N/A | — | -$0.42 |
Industry Average 2 peers with valid PE | — | 11.90x | baseline | — |
* N/A — Company is not profitable (TTM) · excluded from industry average · ▸ FMP /stock-peers + /ratios?limit=1 · priceToEarningsRatio
About PE Ratio & Methodology
The price-to-earnings (P/E) ratio for China Customer Relations Centers, Inc. (CCRC) measures how much investors pay for each dollar of the company's trailing earnings. CCRC's current PE ratio of N/A is calculated by dividing its stock price of $6.50 by its TTM earnings per share of —.
Frequently asked questions
CCRC pe ratio · 6 questionsCCRC's current PE ratio is N/A as of 2026-06-09, based on a stock price of $6.50 and TTM EPS of —. Data sourced from Financial Modeling Prep via CCRC's SEC 10-K and 10-Q filings.
▸ Source: FMP · /ratios-ttm · /ratios annual · /analyst-estimates · /stock-peers · China Customer Relations Centers, Inc. SEC 10-K & 10-Q filings · US GAAP · Updated: 2026-06-09